Hello every one, In this blog, we will learn how to display charts like Line, Column, Bar, Pie using VizFrame in SAPUI5 applications.
Lets get started.
In this example we will create a Pie Chart using VizFrame(sap.viz.ui5.controls.VizFrame) in SAPUI5. Viz Frame is available in “sap.viz.ui5.controls” library.
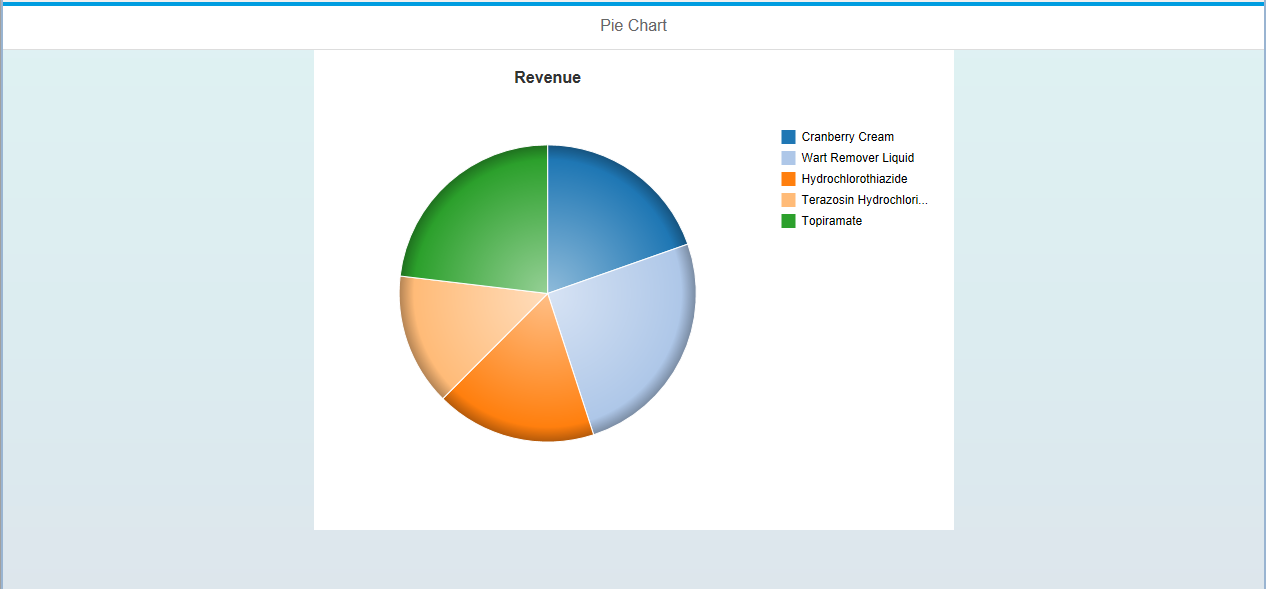
Pie Chart using VizFrame(sap.viz.ui5.controls.VizFrame) in SAPUI5
Step-by-Step Procedure
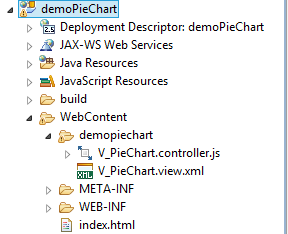
1. Create an SAPUI5 application project in Eclipse IDE with a view and controller.
2. Double click on the view “V_PieChart.view.xml” to add the VizFrame to create pie chart. Copy and paste the below code into the view.
<core:View xmlns:core="sap.ui.core" xmlns:mvc="sap.ui.core.mvc"
	xmlns="sap.m" controllerName="demopiechart.V_PieChart"
        xmlns:viz="sap.viz.ui5.controls"
	xmlns:html="http://www.w3.org/1999/xhtml">
	<Page title="Pie Chart">
		<content>
		<FlexBox justifyContent="Center" alignItems="Start">
		  <items>
			<viz:VizFrame xmlns="sap.viz" id="idpiechart" vizType="pie"/>
		 </items>
		</FlexBox>
		</content>
	</Page>
</core:View>
3. Now double click on controller “V_PieChart.controller.js” to add the java script code necessary to set the data to the pie chart and different chart properties. We are going to write the code in onInit( ) method of the controller.
//      1.Get the id of the VizFrame
		var oVizFrame = this.getView().byId("idpiechart");

//      2.Create a JSON Model and set the data
		var oModel = new sap.ui.model.json.JSONModel();
		var data = {
			'Sales' : [{
				  "DrugName": "Cranberry Cream",
				  "Revenue": "7.37"
				}, {
				  "DrugName": "Wart Remover Liquid",
				  "Revenue": "9.54"
				}, {
				  "DrugName": "Hydrochlorothiazide",
				  "Revenue": "6.57"
				}, {
				  "DrugName": "Terazosin Hydrochloride",
				  "Revenue": "5.41"
				}, {
				  "DrugName": "Topiramate",
				  "Revenue": "8.69"
				}]};
		oModel.setData(data);

//      3. Create Viz dataset to feed to the data to the graph
		var oDataset = new sap.viz.ui5.data.FlattenedDataset({
			dimensions : [{
			        name : 'Drug Name',
				value : "{DrugName}"}],

			measures : [{
				name : 'Revenue',
				value : '{Revenue}'} ],

			data : {
				path : "/Sales"
			}
		});
		oVizFrame.setDataset(oDataset);
		oVizFrame.setModel(oModel);

//      4.Set Viz properties
		oVizFrame.setVizProperties({
			title:{
				text : "Revenue"
			},
            plotArea: {
            	colorPalette : d3.scale.category20().range(),
            	drawingEffect: "glossy"
                }});

		var feedSize = new sap.viz.ui5.controls.common.feeds.FeedItem({
		      'uid': "size",
		      'type': "Measure",
		      'values': ["Revenue"]
		    }),
		    feedColor = new sap.viz.ui5.controls.common.feeds.FeedItem({
		      'uid': "color",
		      'type': "Dimension",
		      'values': ["Drug Name"]
		    });
		oVizFrame.addFeed(feedSize);
		oVizFrame.addFeed(feedColor);
4. Copy and paste the below code in “index.html”.
<!DOCTYPE HTML>
<html>
	<head>
		<meta http-equiv="X-UA-Compatible" content="IE=edge">
		<meta http-equiv='Content-Type' content='text/html;charset=UTF-8'/>

		<script src="resources/sap-ui-core.js"
				id="sap-ui-bootstrap"
				data-sap-ui-libs="sap.m"
				data-sap-ui-theme="sap_bluecrystal">
		</script>
		<!-- only load the mobile lib "sap.m" and the "sap_bluecrystal" theme -->

		<script>
		sap.ui.localResources("demopiechart");
		var app = new sap.m.App({initialPage:"idV_PieChart1"});
		var page = sap.ui.view({id:"idV_PieChart1",
                                        viewName:"demopiechart.V_PieChart",
                                        type:sap.ui.core.mvc.ViewType.XML});
		app.addPage(page);
		app.placeAt("content");
		</script>

	</head>
	<body class="sapUiBody" role="application">
		<div id="content"></div>
	</body>
</html>
5. Save the application and execute the “index.html” of the application to see the output.
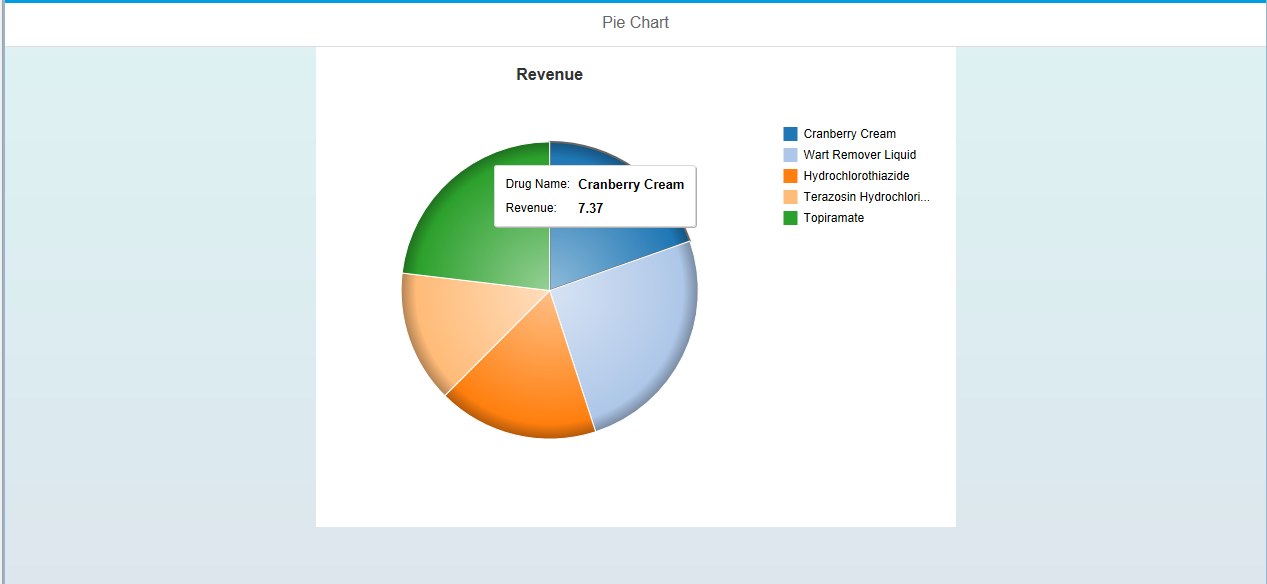
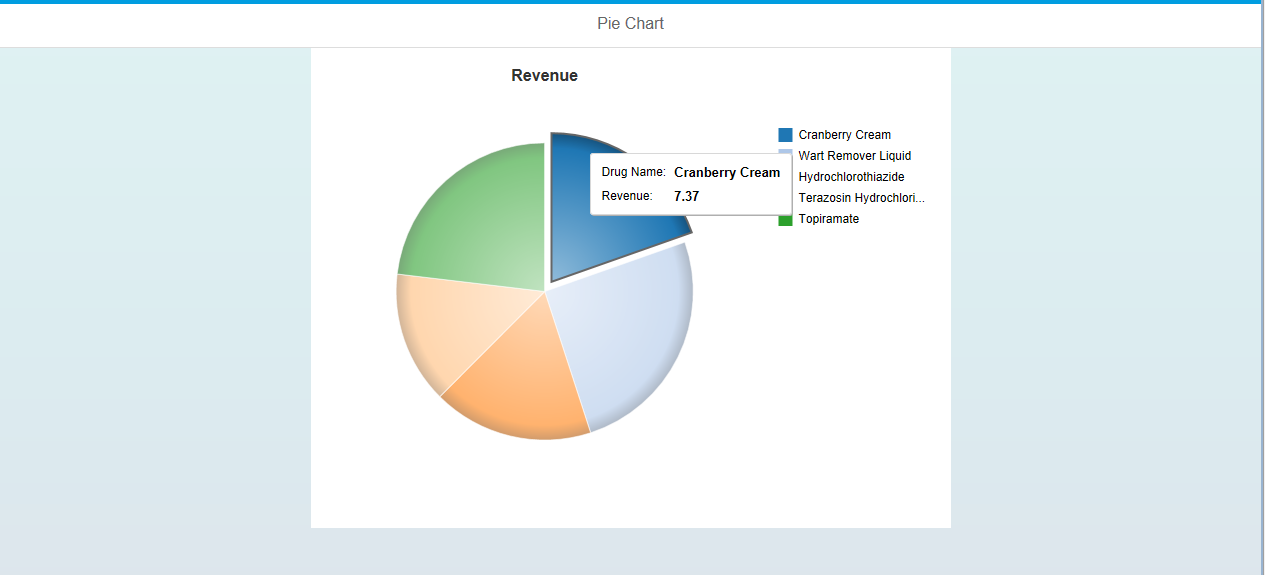
Pie Chart Visualizations:
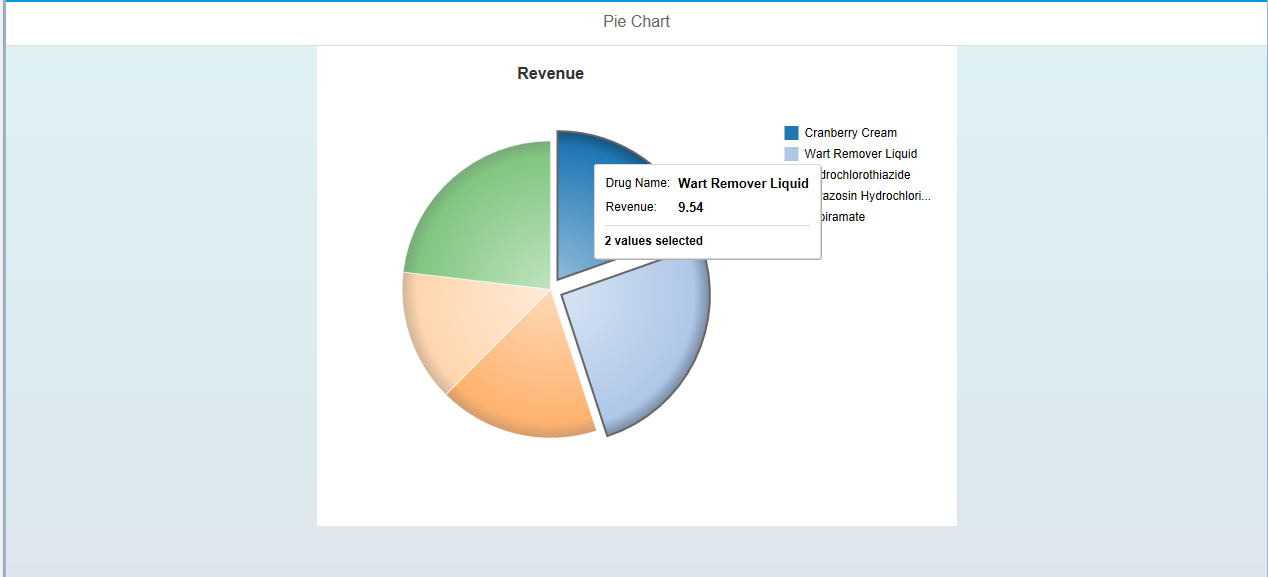
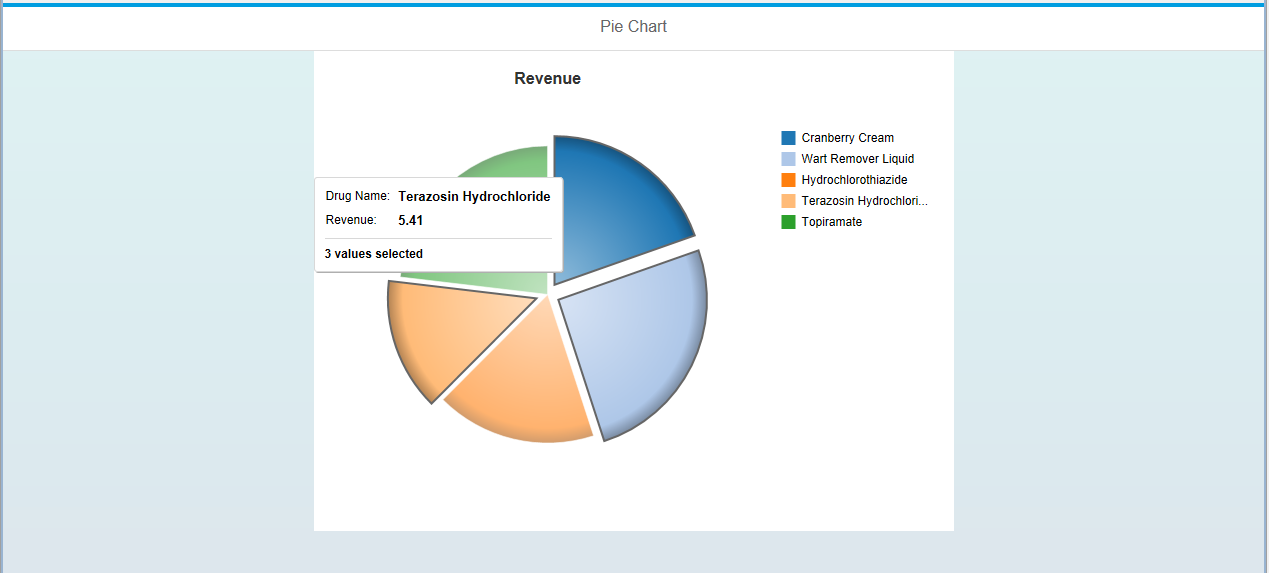
Congrats, you have successfully created Pie chart in SAPUI5 application using VizFrame.
Please stay tuned to us for more SAPUI5 tutorials.Please feel free to comment and let us know your feedback. You feedback will keep us alive.


Comments are closed.