Understanding your SAP BTP service consumption and associated costs is crucial for optimizing resource allocation and budgeting effectively. The new page called Costs and Usage in SAP BTP cockpit serves as a central hub for comprehensive monitoring and analysis. In this blog we will provide detailed exploration delves into the intricacies of this page, unpacking its features, functionalities, and the valuable insights it offers for both subscription-based and consumption-based commercial models.
Table of Contents
Overview of Costs and Usage
In Q1 2024, SAP has introduced the new page “Costs and Usage” which replaces the Usage Analytics in SAP BTP Cockpit. The Cost and Usage page is visible to consumption-based global accounts. For global accounts with only a subscription-based commercial agreement, this new page is called “Usage“.
- The new “Costs and Usage” page offers a refreshed look and exciting new features focused on improving cost transparency for service consumption in global accounts.
- The previous features from the “Usage Analytics” page are still available but may work differently in the new page.
- “Usage” in subscription-based global accounts does not include the billing-related features mentioned below.
The new capabilities of Costs and Usage in SAP BTP cockpit includes:
- Billing Verification: Verify billing accuracy using data and terminology from monthly balance statements.
- Cross Charging Analysis: Track and manage costs across the account hierarchy using labels and filters.
- Advanced Usage and Cost Monitoring: Compare usage and costs across multiple services, analyze trends, and drill down into subaccounts.
- Direct Access to Filtered Views: Bookmark filters and search queries for quicker access and easier sharing.
Navigating Costs and Usage in SAP BTP Cockpit
Upon navigating to Costs and Usage in SAP BTP cockpit, you’ll be greeted by two prominent cards at the top. The left card displays general information about your global account
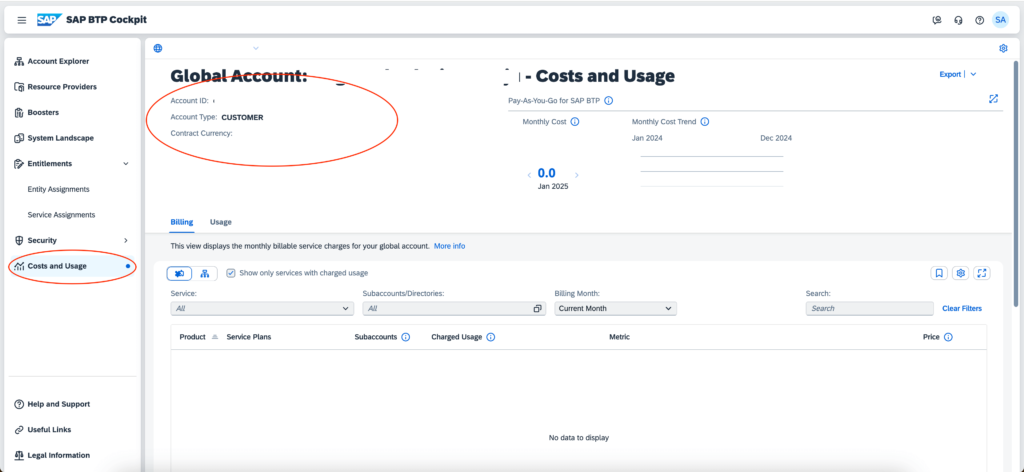
while the right card caters to your specific commercial model.
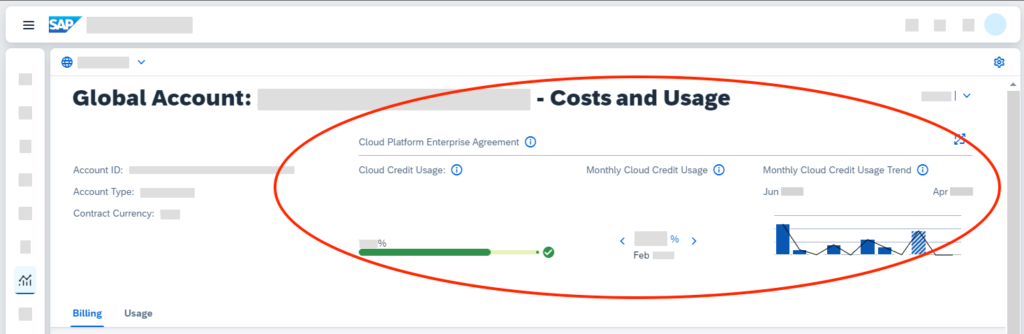
For consumption-based model like Cloud Platform Enterprise Agreement (CPEA), you’ll see details like cloud credit usage, monthly charges, and contract information.
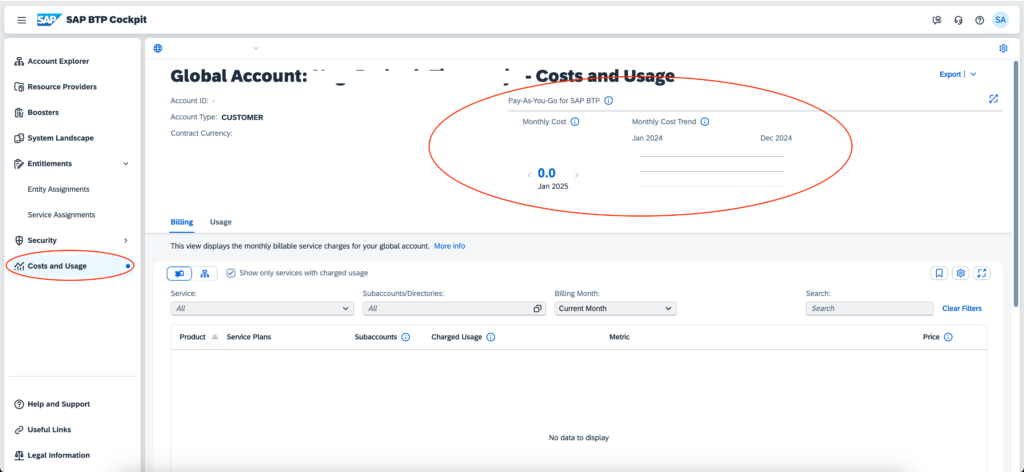
For consumption-based model like Pay-As-You-Go, you’ll see details like monthly cost, monthly cost trend.
If you use a subscription-based model, the data focuses solely on exceeding your prepaid quota.
If a global account uses a combination of consumption-based and subscription-based commercial models, the “Costs and Usage” page will show the following:
- For services under the consumption-based model, it will display the complete billing and usage data.
- For services under the subscription-based model, it will only show billing and usage data for any consumption that exceeds the pre-paid/subscribed quota.
- For the usage within the pre-paid quota of subscription-based services, the billing and usage data will not be shown on this page.
- Any excess usage beyond the subscribed quota for subscription-based services will be charged according to the rates defined in the contract for the consumption-based commercial model.
So in a mixed commercial model scenario, this page essentially separates out and focuses only on the consumption-based billing and usage, while the subscription-based usage within quota is not reflected here.
Export Costs and Usage Data
The new Costs and Usage page provide an export feature allowing users to extract detailed usage and cost information for analysis and reporting purposes, with the content varying based on the commercial model.
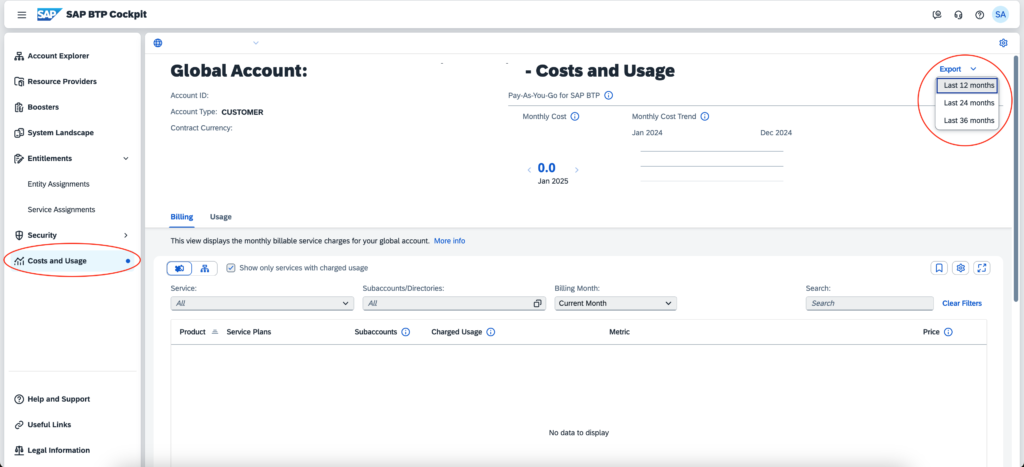
- You can export usage and cost data to a Microsoft Excel file covering the last 12, 24, or 36 months.
- The exported file contains several sheets, depending on the commercial model used by the global account (subscription-based, consumption-based, or a combination).
- The sheets include:
- Global Account Info: General information about the global account and cloud credit usage.
- Global Account Costs: Total monthly usage data and costs for billable services (only for consumption-based model).
- Subaccount Costs by Service: Monthly usage data and estimated costs by plan and subaccount (only for consumption-based model).
- Actual Usage: Actual monthly usage data of consumed services by plan, subaccount, and space (for both models).
- Labels: User-defined labels assigned to subaccounts with usage data (for both models).
- For subaccount costs, the calculations are estimations based on proportional global account usage.
- Actual usage data may differ from billed usage and includes non-billable services.
- The exported data does not consider any filters applied in the cockpit.
Billing and Usage
Costs and Usage page contains two main views: Billing and Usage. Each view offers unique perspectives on your consumption data, tailored to your specific needs.
1. Billing
The “Billing” view monitors and analyze monthly charges for services consumed by subaccounts in a global account. The main features are:
- The Billing view displays aggregated usage and rating data based on the pricing structure of each service over the last 12 months.
- It has two perspectives: “View by Service” and “View by Directory or Subaccount”.
- “View by Service” provides an overview of charged usage across services and plans, allowing drilling down to see subaccount details.
- “View by Directory or Subaccount” shows charged usage across subaccounts and directories in the account hierarchy, with the ability to drill down to service plan details.
- Both perspectives offer filtering, sorting, searching, and graphing capabilities to analyze usage trends and costs.
- Deleted subaccounts with charges in the last 12 months are still listed and marked as “(deleted)”.
- For accounts with both subscription-based and consumption-based models, the view separates usage within the prepaid quota (not charged) and usage exceeding the quota (charged based on consumption rates).
The Billing view aims to provide detailed visibility into service consumption, costs, and cross-charges across the global account structure for verification and analysis purposes.
2. Usage
The “Usage” view monitors and analyze the actual (raw) monthly usage metrics for services consumed by subaccounts in a global account over the last 12 months.
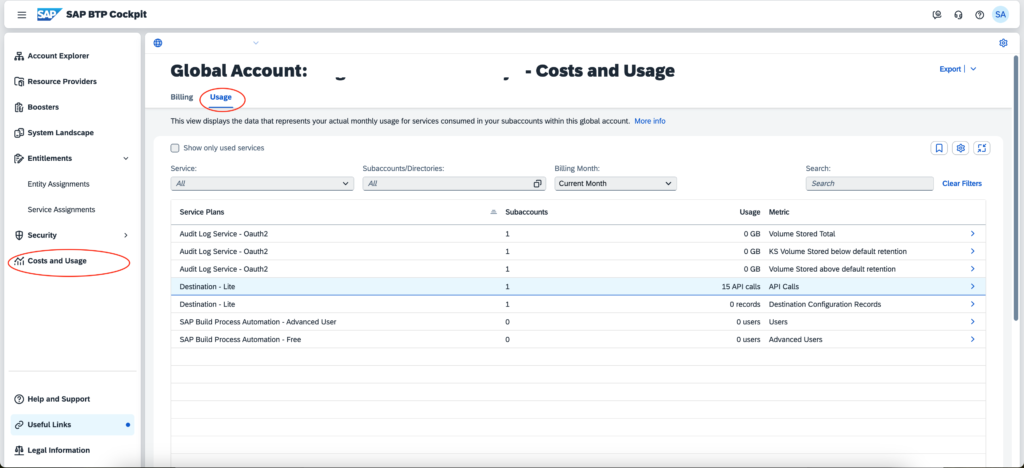
The main features are:
- The Usage view displays raw usage data before aggregation for billing purposes.
- It may include free services and metrics that are not used for billing, leading to discrepancies compared to the “Billing” view.
- For accounts with only a consumption-based model, it includes all usage data, including free services.
- For accounts with both consumption-based and subscription-based models, it combines all usage data across both models and free services.
- Users can drill down to see usage details by service and subaccount.
- Filtering options are available for services, subaccounts, and directories.
- A graph displays monthly usage trends for selected services over the last 12 months.
- Other features like sorting, searching, and column management are available.
The Usage view provides transparency into the raw, granular usage metrics across services and accounts, which may differ from the billable usage data shown in the Billing view due to aggregation and rating calculations.
Additional Resources
- Enhancing Costs, Usage and Contract Transparency (Technology Blogs by SAP)

: A Step-by-Step Tutorial")


